Explore
Featured
Recent
Articles
Topics
Login
Upload
Featured
Recent
Articles
Topics
Login
Upload
Search Results for 'D-Figure'
D-Figure published presentations and documents on DocSlides.
Figure 2Tech NotesGround/Radial SystemsGROUND MOUNTINGA vertical anten
by trish-goza
-1- Figure 1 -2- Figure 3 Figure 4 Figure 5loss re...
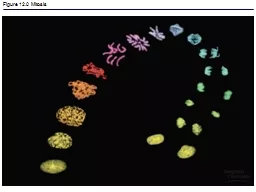
Figure 12.0 Mitosis Figure 12.1a The functions of cell division: Reproduction
by sistertive
Figure 12.1b The functions of cell division: Grow...
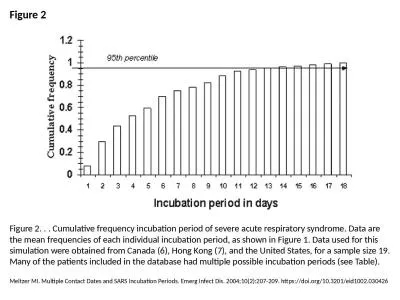
Figure 2 Figure 2. . . Cumulative frequency incubation period of severe acute respiratory syndrome.
by skylar
Meltzer MI. Multiple Contact Dates and SARS Incuba...
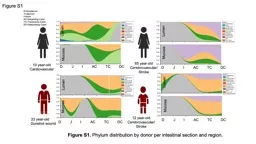
Figure S1 Figure S1. Phylum distribution by donor per intestinal section and region.
by sadie
Figure S2. (d). (c). Figure S2.. Distribution of ...
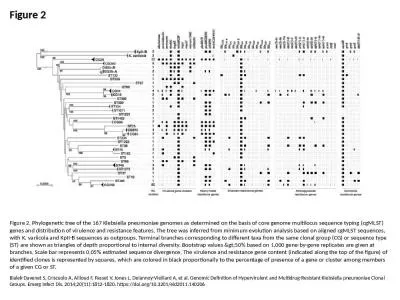
Figure 2 Figure 2. Phylogenetic tree of the 167 Klebsiella pneumoniae genomes as determined on the
by elise
Bialek-Davenet S, Criscuolo A, Ailloud F, Passet V...
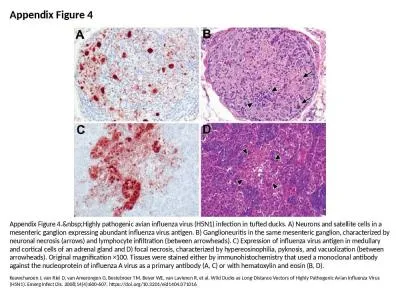
Appendix Figure 4 Appendix Figure 4. Highly pathogenic avian influenza virus (H5N1) infect
by elizabeth
Keawcharoen J, van Riel D, van Amerongen G, Besteb...
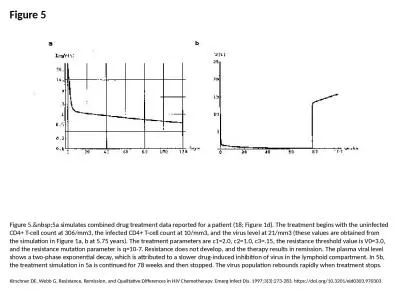
Figure 5 Figure 5. 5a simulates combined drug treatment data reported for a patient (18; F
by ximena
Kirschner DE, Webb G. Resistance, Remission, and Q...
Figure 2 Figure 2. . Minimum spanning tree generated from variable number tandem repeat (VNTR) data
by finley
Rhyan JC, Nol P, Quance C, Gertonson A, Belfrage J...
FIGURE RETORICHE figure di posizione
by dandy
altre figure. figure di significato. Riguardano la...
2.KaleidoscopicTilings2.1Tilingsonsurfacessurfaceisatwo-dimensionalobj
by test
4Chap.2KaleidoscopicTilings Figure2.1Agenus2surfac...
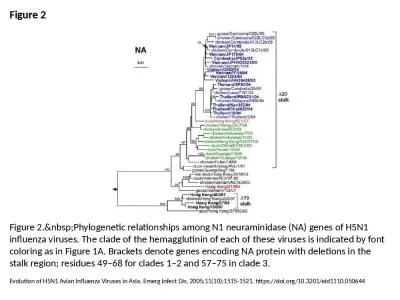
Figure 2 Figure 2. Phylogenetic relationships among N1 neuraminidase (NA) genes of H5N1 in
by martin
Evolution of H5N1 Avian Influenza Viruses in Asia....
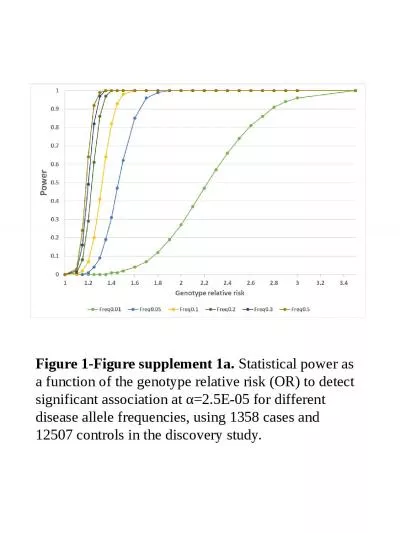
Figure 1-Figure supplement 1a.
by piper
Statistical power as a function of the genotype re...
Figure 1 Figure 1. Phylogenetic tree of hemagglutinin (HA) segments from 36 avian influenz
by audrey
Salzberg SL, Kingsford C, Cattoli G, Spiro DJ, Jan...
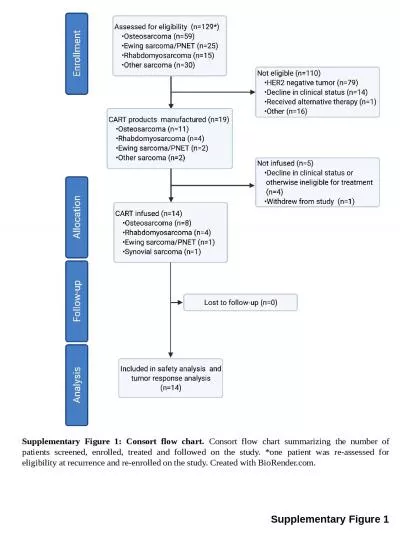
Supplementary Figure 1 Supplementary Figure 1: Consort flow chart.
by leah
Consort flow chart summarizing the number of patie...
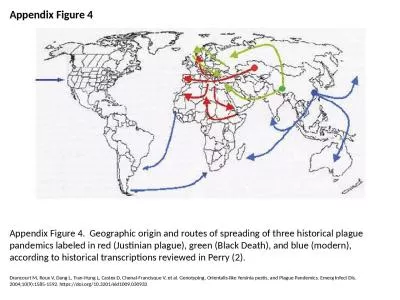
Appendix Figure 4 Appendix Figure 4. Geographic origin and routes of spreading of three historical
by naomi
Drancourt M, Roux V, Dang L, Tran-Hung L, Castex D...
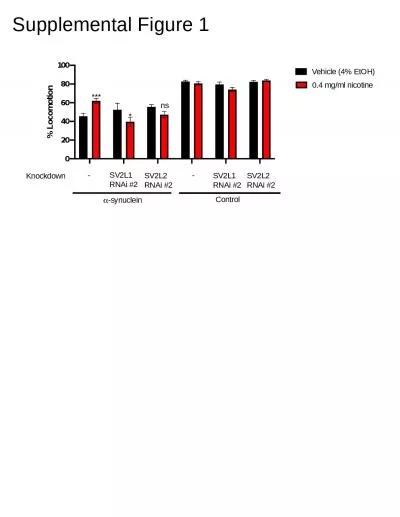
Supplemental Figure 1 Supplemental Figure 2
by evelyn
A.. B.. Supplemental Figure 3. Control. α-synucle...
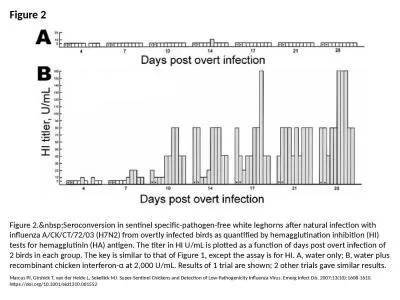
Figure 2 Figure 2. Seroconversion in sentinel specific-pathogen-free white leghorns after
by taylor
Marcus PI, Girshick T, van der Heide L, Sekellick ...
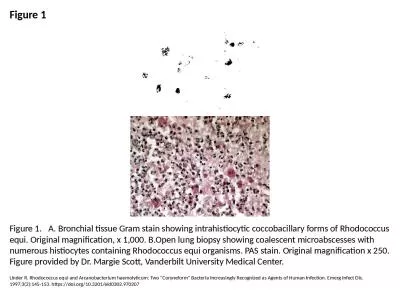
Figure 1 Figure 1. A. Bronchial tissue Gram stain showing intrahistiocytic coccobacillary forms o
by scarlett
Linder R. Rhodococcus equi and Arcanobacterium hae...
Figure 6-1 part 1 Figure 6-1 part 2
by bency
Figure 6-1 part 3. Figure 6-1 part 4. Page 127. Th...
Figure Legend Figure 1 Ovary Cystin a female B6C3F1N mouse from a
by claire
Ovary – Cyst 1 Ovary – Cyst cysts incr...
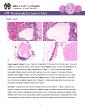
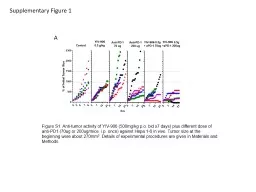
Supplementary Figure 1 Figure S1. Anti-tumor activity of
by dora
YIV-906. (500mg/kg . p.o.. bid . x7. days) plus...
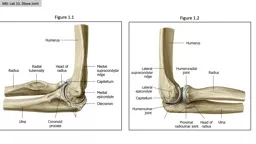
Figure 1.1 Figure 1.2 MSI: Lab 10, Elbow Joint
by vivian
Figure 1.3. Figure 1.4. Radius. Ulna. Humerus. Ann...
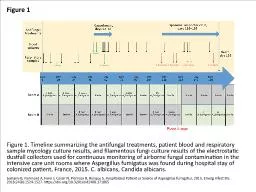
Figure 1 Figure 1. Timeline summarizing the antifungal treatments, patient blood and respiratory sa
by emmy
Lemaire B, Normand A, Forel J, Cassir N, Piarroux ...
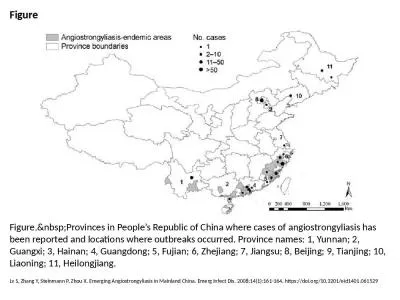
Figure Figure. Provinces in People’s Republic of China where cases of angiostrongyliasis
by ani
Lv S, Zhang Y, Steinmann P, Zhou X. Emerging Angio...
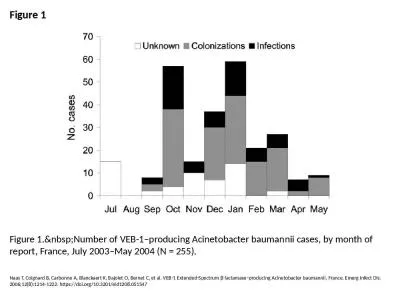
Figure 1 Figure 1. Number of VEB-1–producing Acinetobacter baumannii cases, by month of
by zoe
Naas T, Coignard B, Carbonne A, Blanckaert K, Bajo...
Women’s Figure Skating History Of Women’s Figure Skating
by stefany-barnette
Women’s Figure Skating History Of Women’s Fi...
toringsystems(ITS),howeverlittleisknownabouthowthesedesignswilltransla
by mitsue-stanley
(a) (b) (c)Figure2.Screenshotsoftheembeddedhints.F...
Figure Input Bins Figure Printer Tray Templates Figure Adapter Kit
by celsa-spraggs
brPage 1br Figure 1 Input Bins Figure 2 Printer Tr...
4 Figure and 6 Figure Grids
by karlyn-bohler
L.O: . Identify places on maps using gridlines. S...
Baby Bloomer™ Gro-Rock You are in for a fascinating gardening exp
by sherrill-nordquist
Figure A Figure C Figure D Figure B surface. If o...
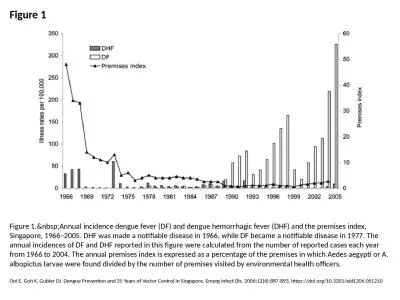
Figure 1 Figure 1. Annual incidence dengue fever (DF) and dengue hemorrhagic fever (DHF) a
by thomas
Ooi E, Goh K, Gubler DJ. Dengue Prevention and 35 ...
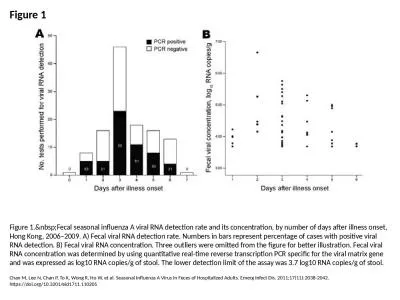
Figure 1 Figure 1. Fecal seasonal influenza A viral RNA detection rate and its concentrati
by bery
Chan M, Lee N, Chan P, To K, Wong R, Ho W, et al. ...
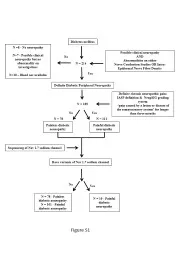
Figure S 1 Painless diabetic neuropathy
by hailey
Painful diabetic neuropathy. N = 78. No. Yes. N = ...
Figure 5 Figure 5. . . The horizontal axes in these 4 plots give the original room deposition level
by udeline
Wein LM, Liu Y, Leighton TJ. HEPA/Vaccine Plan for...
SUPPLEMENTARY FIGURES Figure S1
by patricia
Figure S2. A. B. C. D. Figure S3. A. B. C. D. Figu...
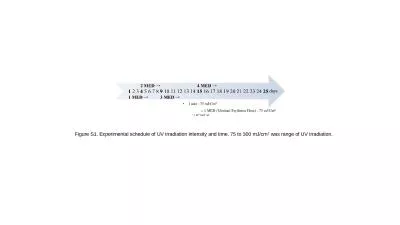
Figure S1. Experimental schedule of UV irradiation intensity and time. 75 to 300
by desha
mJ. /cm. 2. was range of UV irradiation.. Supplem...
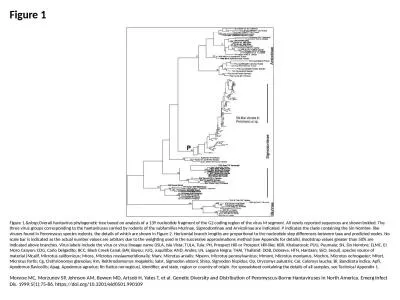
Figure 1 Figure 1. Overall hantavirus phylogenetic tree based on analysis of a 139 nucleot
by emmy
Monroe MC, Morzunov SP, Johnson AM, Bowen MD, Arts...
Figure 1 Location of the
by anderson
colon in the body. Ulcerative Colitis: Introd...
Figure i.1 Trends in the adjusted* incidence rate (per million/year) of ESRD
by reagan
(bars; scale on right), and annual change (%) in t...
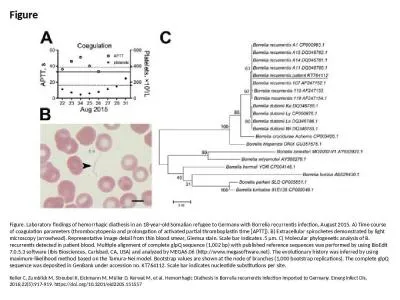
Figure Figure. Laboratory findings of hemorrhagic diathesis in an 18-year-old Somalian refugee to G
by yvonne
Keller C, Zumblick M, Streubel K, Eickmann M, Mül...
Load More...