/
Transportation Problem  and Related Topics Transportation Problem  and Related Topics

Transportation Problem and Related Topics - PowerPoint Presentation

stefany-barnette
stefany-barnette . @stefany-barnette
Follow
384 views
Uploaded On 2016-06-22

Transportation Problem and Related Topics - PPT Presentation

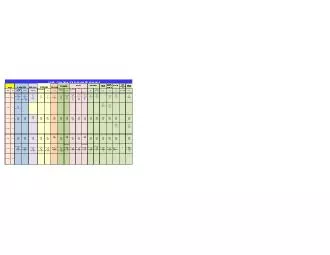
There are 3 plants 3 warehouses Production of Plants 1 2 and 3 are 100 150 200 respectively Demand of warehouses 1 2 and 3 are 170 180 and 100 units respectively Transportation costs for ID: 373367

transportation problem product 100 problem transportation 100 product origin demand set volume destination supply 150 200 warehouse 170 180 cost warehouses constraints

Share:

Link:

Embed:

Download Presentation from below link

Download Presentation The PPT/PDF document "Transportation Problem and Related Topi..." is the property of its rightful owner. Permission is granted to download and print the materials on this web site for personal, non-commercial use only, and to display it on your personal computer provided you do not modify the materials and that you retain all copyright notices contained in the materials. By downloading content from our website, you accept the terms of this agreement.


Presentation Transcript

Slide1

Transportation Problem and Related TopicsSlide2

There are 3 plants, 3 warehouses.

Production of Plants 1, 2, and 3 are 100, 150, 200 respectively.

Demand of warehouses 1, 2 and 3 are 170, 180, and 100 units respectively.

Transportation costs for each unit of product is given below

Transportation problem : Narrative representation

Warehouse 1 2 3 1 12

11 13Plant 2 14 12

16 3 15 11 12

Formulate this problem as an LP to satisfy demand at minimum

transportation costs.Slide3

Plant 1

Warehouse 1

Plant

2

Plant 3

Warehouse 2

Warehouse 3

Data for the Transportation Model

Quantity demanded at each destination

Quantity supplied from each origin

Cost between origin and destinationSlide4

$

12

$

11

$

13

$

12

Plant 1

Plant 2

Plant 3

Warehouse 1

Warehouse

2

Warehouse 1$14

$16

$12

$11$15

Supply LocationsDemand Locations

100150

200Data for the Transportation Model

170

100

180Slide5

Transportation problem I : decision

variables

1

2

1

3

3

100

x

11

x

12

2

150

200

100

180

170

x

13

x

21

x31

x22x32

x23

x33Slide6

Transportation problem I : decision variables

x

11

= Volume of product sent from P1 to W1x12 = Volume of product sent from P1 to W2x13 = Volume of product sent from P1 to W3

x21 = Volume of product sent from P2 to W1x

22 = Volume of product sent from P2 to W2x23 = Volume of product sent from P2 to W3x31

= Volume of product sent from P3 to W1x32 = Volume of product sent from P3 to W2

x33 = Volume of product sent from P3 to W3Minimize Z = 12 x11

+ 11 x12 +

13 x13 + 14 x21 + 12 x22 +16 x

23 +15 x

31 + 11 x32 +12 x33 Slide7

Transportation problem I : supply and demand

constraints: equal only of Total S = Total D

x

11 + x12 + x13

= 100

x21 + x22 + x23

=150

x31 + x32 + x33

= 200x

11 + x21 + x31

= 170

x12 + x22 + x

32

= 180x13 + x23 + x33

= 100x11, x12, x13, x21, x22, x23, x31, x32, x

33  0Slide8

Transportation problem I : supply and demand

constraints: ≤ for S, ≥ for D always correct

x

11 + x12 + x

13

≤ 100x21 + x22

+ x23

≤ 150x31 + x

32 + x33

≤ 200x11

+ x21 + x

31 ≥ 170x

12

+ x22 + x32 ≥ 180x13

+ x23 + x33 ≥ 100x11, x12, x13, x21, x22

, x23, x31, x32, x33  0Slide9

Origins

We have a set of

ORIGINsOrigin Definition: A source of material

- A set of Manufacturing Plants- A set of Suppliers- A set of Warehouses- A set of Distribution Centers (DC)In general we refer to them as Origins

m

1

2

i

s

1

s

2

s

i

smThere are m origins i=1,2, ………., mEach origin i has a supply of siSlide10

Destinations

We have a set of

DESTINATIONsDestination Definition: A location with a demand for material

- A set of Markets- A set of Retailers- A set of Warehouses- A set of Manufacturing plantsIn general we refer to them as Destinations

n

1

2

j

d

1

d

2

d

i

dnThere are n destinations j=1,2, ………., nEach origin j has a supply of djSlide11

There

is only one route between each pair of origin and destinationItems to be shipped are all the samefor each and all units sent from origin i to destination j there is a shipping cost of Cij per unit

Transportation Model Assumptions Slide12

C

ij : cost of sending one unit of product from origin i to destination j

m

1

2

i

n

1

2

j

C

1n

C

12

C

11

C

2n

C

22C21

Use Big M (a large number) to eliminate unacceptable routes and allocations. Slide13

X

ij : Units of product sent from origin i to destination j

m

1

2

i

n

1

2

j

x

1n

x

12

x

11

x

2n

x

22

x21Slide14

The Problem

m

1

2

i

n

1

2

j

The problem is to determine how

much material is sent from each

origin to each destination, such

that all demand is satisfied at the

minimum transportation costSlide15

The Objective Function

m

1

2

i

n

1

2

j

If we send

X

ij

units

from origin

i to destination j, its cost is Cij X

ijWe want to minimize Slide16

Transportation problem I : decision variables

1

2

1

3

3

100

x

11

x

12

2

150

200

1

00

180

170

x

13

x

21

x31

x22x32

x23

x33Slide17

Transportation problem I : supply and demand constraints

x

11

+ x12 + x13

=100 +x

21 + x22 + x23 =150

+x31

+ x32 + x33 =200

x11 +

x21 + x31 =

170 x

12 + x22 + x32

=

180 x13 + x23 + x33 =

100In transportation problem. each variable Xij appears only in two constraints, constraints i and constraint m+j, where m is the number of supply nodes. The coefficients of all the variables in the constraints are 1.Slide18

Our Task

Our main task is to formulate the problem.

By problem formulation we mean to prepare a tabular representation for this problem.Then we can simply pass our formulation ( tabular representation) to EXCEL. EXCEL will return the optimal solution.

What do we mean by formulation? Slide19

Cost Table

Slide20

Right Hand Side (RHS)Slide21

Left Hand Side (RHS), and Objective FunctionSlide22

≤ for Supply, ≥ for Demand unless

Some Equality Requirement is EnforcedSlide23

≤ for Supply, ≥ for Demand unless

Some Equality Requirement is EnforcedSlide24

Optimal Solution

Extra Credit. How the colors were generated and what they mea?

Using Conditional formatting.

Green if the decision variable is >0

Red if the constraint is binding LHS = RHSSlide25

Example: Narrative Representation

We have 3 factories and 4 warehouses.

Production of factories are 100, 200, 150 respectively.Demand of warehouses are 80, 90, 120, 160 respectively.Transportation cost for each unit of material from each origin to each destination is given below. Destination

1 2 3 4 1 4 7 7 1Origin 2 12 3 8 8 3 8 10 16 5

Formulate this problem as a transportation problemSlide26

Excel : DataSlide27

11 repairmen and 10 tasks. The time (in minutes) to complete each job by each repairman is given below.

Assign each task to one repairman in order to minimize to total repair time by all the repairmen.

In the assignment problem, all RHSs are 1. That is the only difference with the transportation problem,.

The Assignment Problem : ExampleSlide28

The Assignment Problem : Example