/
Research involving diverse and special populations brings challenges for producing evidence-based Research involving diverse and special populations brings challenges for producing evidence-based

Research involving diverse and special populations brings challenges for producing evidence-based - PowerPoint Presentation

alexa-scheidler
alexa-scheidler . @alexa-scheidler
Follow
408 views
Uploaded On 2018-03-16

Research involving diverse and special populations brings challenges for producing evidence-based - PPT Presentation

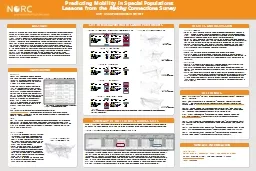
Making Connections Survey an evaluation of lowincome communities in ten US cities reveal differences in residential mobility between sites In the present research we explore the geographic nature of these differences and examine factors which may influence them including household and ID: 653107

moves mobility survey sites mobility moves sites survey denver white respondents center data site table antonio san research figure

Share:

Link:

Embed:

Download Presentation from below link

Download Presentation The PPT/PDF document "Research involving diverse and special p..." is the property of its rightful owner. Permission is granted to download and print the materials on this web site for personal, non-commercial use only, and to display it on your personal computer provided you do not modify the materials and that you retain all copyright notices contained in the materials. By downloading content from our website, you accept the terms of this agreement.


Presentation Transcript

Slide1

Research involving diverse and special populations brings challenges for producing evidence-based estimates of mobility. Accurate predictions of mobility between collection periods are necessary in planning longitudinal surveys, as mobility influences survey costs. Data derived from five sites studied as part of the

Making Connections

Survey, an evaluation of low-income communities in ten U.S. cities, reveal differences in residential mobility between sites. In the present research we explore the geographic nature of these differences and examine factors which may influence them, including household and neighborhood characteristics. We present five Making Connections sites as case studies of mobility among special populations (i.e. those living in poverty) that may experience macro-level factors in ways unlike those observed in the general population. We will compare data from the Making Connections Survey to data collected through the American Community Survey (ACS) to explain differences in mobility across sites, and to consider the varied “lessons” offered by the two sources. These comparisons will provide a basis for logistic regression models predicting residential mobility among survey participants and may inform future attempts to anticipate movement among economically disadvantaged populations.

ABSTRACT

SITE DEMOGRAPHIC PROFILES AND REPORTED MOVES

Summary of Results

Rates of mobility are highest in Denver. Denver respondents were consistently more likely to report one, two, or three or more moves during the past three years than respondents in other sites. Denver is clearly the highest educated site with an estimated 27% of the population being college-educated. Also influential here is the lower rates of home ownership.

Rates of mobility are lowest in San Antonio. This site has the highest rate of home ownership. Here the population is distinct in that it is largely Hispanic and U.S.-born. Despite the proximity of San Antonio to Mexico, transnational migration was rarely reported (less than 1% of moves).Among the sites with similar levels of mobility (Des Moines, Indianapolis, and White Center), White Center has more college-educated persons. This may help explain the higher rate of cross-continental mobility observed in White Center and Denver. LimitationsThese five sites are not representative of poor urban communities nationwide.Multivariate logistic regression modeling is necessary to evaluate the impact of community factors (especially labor force participation, education, and homeownership) when controlling for demographic and financial characteristics at the household level. This is the next step in our research.ConclusionsDespite a large body of research on mobility, predicting residential mobility is a difficult and complex activity, particularly when dealing with special populations.We observe marked variation in the spatial distribution and distance of moves across sites. Denver and San Antonio respondents have patterns of mobility that mirror trends observed in the ACS data.White Center emerges as an anomaly among the three sites with intermediate rates of mobility. It has a very large concentration of Asian, Hispanic, and foreign-born residents (15%,19%, and 26% respectively), mid-to-high education levels (15% of residents have a college degree), and strong employment figures. That 34% of the community population speaks a language other than English at home suggests that ethnic enclaves may exert a strong influence on mobility in White Center.

RESULTS AND DISCUSSION

Bolan, Marc. May 1997. “The Mobility Experience and Neighborhood Attachment.”

Demography 34(2): pp. 225-237. Cohn, D’Vera and Rich Morin. 29 December 2008. “Who Moves? Who Stays Put? Where’s Home?” Pew Research Center Social & Demographic Trends. Released 17 December 2008. Available online at http://pewsocialtrends.org/2008/12/17/who-moves-who-stays-put-wheres-home. Coulton, Claudia; Theodos, Brett; and Margery Turner. November 2009. "Family Mobility and Neighborhood Change: New Evidence and Implications for Community Initiatives." Report prepared for the Annie E. Casey Foundation by the Urban Institute. Washington, D.C. Frey, William. December 2009. “The Great American Migration Slowdown: Regional and Metropolitan Dimensions.” Metropolitan Policy Program at Brookings. Available online at www.brookings.edu/metro.South, Scott; Crowder, Kyle, and Katherine Trent. December 1998. “Children’s Residential Mobility and Neighborhood Environment following Parental Divorce and Remarriage.” Social Forces 77(2): pp. 667-693.South, Scott and Kyle Crowder. February 1998. “Leaving the 'Hood: Residential Mobility between Black, White, and Integrated Neighborhoods.” American Sociological Review 63(1): pp. 17-26.South, Scott and Kyle Crowder. November 1998. “Avenues and Barriers to Residential Mobility among Single Mothers.” Journal of Marriage and Family 60(4): pp. 866-877.

REFERENCES

SUMMARY OF DIFFERENCES ACROSS SITES

Interestingly, stability seems to be highest in San Antonio, the largest site in terms of neighborhood size. 63% of San Antonio respondents had not moved in the past three years, and among those who had moved, relocation from outside the county was extremely rare (2.4% versus 11.5% among all sites). Conversely, in Denver, the frequent movement among survey respondents is consistent with an ownership rate of under 40% in the community population - the lowest of the five sites. Among those respondents who moved three or more times during the past three years, Denver residents are noticeably more likely to have moved from outside of the county and Figure 2 reveals that Denver respondents had moved from all over the U.S. This cross-continental movement is also observed in White Center, where, like in Denver, labor force participation rates are high (68% and 67%, respectively, versus the national rate of 65% according to ACS 2005-2009 estimates).

Survey

This research features data from the Making Connections Survey (http://mcstudy.norc.org), a longitudinal and cross-sectional study of ten low income neighborhoods. The survey is part of a larger community change initiative funded by the Annie E. Casey Foundation.Data For this analysis we constructed an address-level dataset containing 2,782 retrospective addresses representing places where the respondent lived since Thanksgiving, 2005. Responses were derived from 2,358 respondents in five sites at wave 3 (2008-2010). The sites are located in Denver, CO; Des Moines, IA; Indianapolis, IN; San Antonio, TX; and White Center (Seattle), WA.

BACKGROUND

(Table 7) Number of Moves by Percent Within and Outside of County by Site

Predicting Mobility in Special Populations: Lessons from the Making Connections SurveyKate Bachtell and Michael Latterner

(Table 2) Denver

(Table 3) Des Moines

(Table 4) Indianapolis

(Table 5) San Antonio

(Table 6) White Center (Seattle)

CONTACT INFORMATION

Kate Bachtell

Survey

Director, Economics, Labor, and Population Studies


55 East Monroe Street, 20th Floor, Chicago IL 60603

bachtell-kate@norc.org

(312) 759-5095

Early Findings

In 2010, we reported that nearly a fifth (18%) of respondents had moved two or more times since the previous wave of the survey, and that the majority of these moves (65%) fell within a five-mile radius. Renters, those in their early 30s, and those with low annual incomes were among the most likely to move frequently. Closer inspection of mobility by site revealed marked geographic patterns (see Figure 1). Cross-continental moves appeared with relative frequency among respondents in Denver and White Center (Seattle), while in Indianapolis and San Antonio almost all movement was contained within the city or county. The goal of this research is to investigate these differences using contextual data from the 2005-2009 American Community Survey.

(Figure 1) Moves During Past Three Years by Site

Sources:Data shown in Tables 2-6 are aggregated from the ACS 2005-2009 tract-level estimates. Figures 2-6 feature data from the Making Connections Survey, Wave 3, 5 sites.

(Figure 2) Denver Moves

(Figure 3) Des Moines Moves

(Figure 4) Indianapolis Moves

(Figure 5) San Antonio Moves

(Figure 6) White Center Moves

(Figures 2-6) Location of Moves by Site

(Tables 2-6) Demographic, Social, and Labor Characteristics by Site

Mobility

Mobility has been shown to impact economic and social well-being and is studied intensely in research on neighborhood effects. Factors found to influence mobility in past empirical studies are summarized in Table 1.

Predicting mobility is complicated by the fact that different populations move at different rates. Between 2007 and 2008, only 12% of Americans changed residences – the lowest percentage on record (Cohn and Morin 2008). Yet after three waves of data collection for the

Making Connections

Survey, we continue to observe movement that exceeds national levels. This is consistent with abundant literature demonstrating that disadvantaged neighborhoods experience higher rates of mobility (Coulton et al 2009).

(Table 1) Factors Found to Influence Mobility

* Authors Key: a = Cohn and Morin (2008); b = South et al (1998); c = South and Crowder (1998).

Table 7 summaries the number of moves reported by respondents in each of the five sites and overall. The white columns distinguish between residences that fell within and outside of the county associated with the original survey neighborhood.