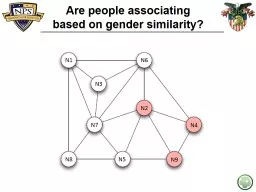
N7 N6 N2 N9 N4 N3 N1 N8 N5 Attribute N1 N2 N3 N4 N5 N6 N7 N8 N9 N1 Male 0 0 1 0 0 1 1 1 0 N2 Female 0 0 0 1 1 1 1 0 1 N3 Male 1 0 0 0 0 1 1 0 0 N4 ID: 803050
Download The PPT/PDF document "Are people associating based on gender ..." is the property of its rightful owner. Permission is granted to download and print the materials on this web site for personal, non-commercial use only, and to display it on your personal computer provided you do not modify the materials and that you retain all copyright notices contained in the materials. By downloading content from our website, you accept the terms of this agreement.
Slide1
Are people associating based on gender similarity?
N7
N6
N2
N9
N4
N3
N1
N8
N5
Slide2Attribute
N1
N2
N3
N4
N5
N6
N7
N8
N9
N1
Male
001001110N2Female000111101N3Male100001100N4Female010001001N5Male010000111N6Male111100100N7Male111011010N8Male100010100N9Female010110000
First Make a Block Model
Slide3Attribute
N1
N2
N3
N4
N5
N6
N7
N8
N9
N2
Female
000111101N4Female010001001N9Female010110000N1Male001001110N3Male100001100N5Male010000111N6Male111100100N7Male111011010N8Male100010100
First Make a Block Model
Slide4Attribute
N2
N4
N9
N1
N3
N5
N6
N7
N8
N2
Female
011001110N4Female101000100N9Female110001000N1Male000010111N3Male000100110N5Male101000011N6Male110110010N7Male100111101N8Male000101010
First Make a Block Model
Slide5Attribute
N2
N4
N9
N1
N3
N5
N6
N7
N8
N2
Female
011001110N4Female101000100N9Female110001000N1Male000010111N3Male000100110N5Male101000011N6Male110110010N7Male100111101N8Male000101010
First Make a Block Model
Block Densities
Slide6Naïve Approach – calculate the fraction of same gender ties
1
1
2
3
4
5
6
7
8
9
10
2372% (13/18) of the edges are between vertices of the same gender N7N6N2N9N4N3N1N8N5
Slide7Finding the number of same-class ties
(“Turn off the mixed-class ties with a
Kronecker
Delta”)
Kronecker
Delta
Slide8Finding the number of same-class ties
(“Turn off the mixed-class ties with a
Kronecker
Delta”)
Kronecker
Delta
Actual number of same-class ties
Slide9Kleinberg’s method of estimating the number of expected edges…
Slide10Proportion of Males and Females
N7
N6
N2
N9
N4
N3
N1
N8
N5
P(Female)
q = 3/9
P(male)p = 6/9
Slide11Probability of Selecting a Male or Female
N7
N6
N2
N9
N4
N3
N1
N8
N5
P(Female)
q = 3/9
q = 1/3 P(male)p = 6/9p = 2/3
Slide12N7
N6
N2
N9
N4
N3
N1
N8
N5
P(Female)
q = 3/9q = 1/3
P(male)
p = 6/9p = 2/3P(m-m)p2 =4/9P(f-f)q2 =1/9P(male-female)P(female-male)2pq = 4/9Probability of a Male selecting a Male-Male, Female-Female, Male-Female
Slide13N7
N6
N2
N9
N4
N3
N1
N8
N5
P(Female)
q = 3/9q = 1/3
P(male)
p = 6/9p = 2/3P(m-m)p2 =4/9p2 =8/18P(f-f)q2 =1/9q2 =2/18P(male-female)P(female-male)2pq = 4/92pq = 8/18Expected number of Male-Male, Female-Female, Male-Female Ties
Slide14N7
N6
N2
N9
N4
N3
N1
N8
N5
P(Female)
q = 3/9q = 1/3
P(male)
p = 6/9p = 2/3P(m-m)p2 =4/9p2 =8/188 M-MP(f-f)q2 =1/9q2 =2/182 F-FP(male-female)P(female-male)2pq = 4/92pq = 8/188 M-FExpected number of Male-Male, Female-Female, Male-Female TiesTotal expected # of same gender ties: 10
Slide15Newman’s approach
“make connections at random while preserving the vertex degrees. Ignoring vertex degrees and making connections truly at random has been show to give much poorer results”
Expected number of same-class ties
If there is no homophily
effect, w
e should expect to see 10.36 same gender ties.
Since we see 13 same gender ties instead of 10.36, there is some evidence of
homophily
We see about 3 more same gender ties than we would expect if gender had no effect on tie formation.
Measuring the Presence of
Homophily
– Calculating modularity
If there is no homophily
effect, w
e should expect to see 57% same gender ties.
Since we see 72% same gender ties instead of 57%, there is some evidence of
homophily
We see 14.6% more same gender ties than what we would expect if
gender had no effect on tie formation
.
The modularity score is
0.146
Measuring the Presence of
Homophily
- Calculating modularity
Slide19A much easier way to calculate modularity using a “Mixing Matrix”
Slide20Making Sociology Relevant:
What
do we want to say?
A few empirical facts:
Some racially heterogeneous schools are socially segregated
Slide21Making Sociology Relevant:
What
do we want to say?
A few empirical facts:
… while other heterogeneous schools are socially integrated.
Why?
Slide22Making Sociology Relevant:
What
do we want to say?
Slide23Assortative Mixing by
Scalar Characteristics
Slide24